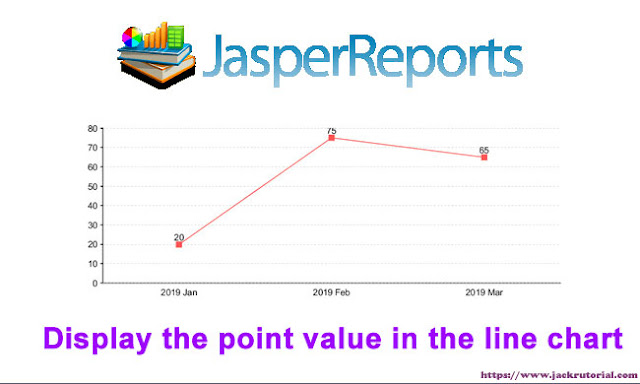
The "Show values" are not there in the chart properties. We'll combine bar and line chart. And we'll display of values for each bar in bar chart.
<?xml version="1.0" encoding="UTF-8"?>
<jasperReport xmlns="http://jasperreports.sourceforge.net/jasperreports" xmlns:xsi="http://www.w3.org/2001/XMLSchema-instance" xsi:schemaLocation="http://jasperreports.sourceforge.net/jasperreports http://jasperreports.sourceforge.net/xsd/jasperreport.xsd" name="rpt_evolution_employee" language="groovy" pageWidth="595" pageHeight="842" columnWidth="555" leftMargin="20" rightMargin="20" topMargin="20" bottomMargin="20" uuid="78c6176f-2418-4197-9b59-d543fa10b467">
 <property name="ireport.zoom" value="2.0"/>
 <property name="ireport.x" value="0"/>
 <property name="ireport.y" value="0"/>
 <queryString>
  <![CDATA[SELECT * FROM evolution_employee]]>
 </queryString>
 <field name="year" class="java.math.BigDecimal">
  <fieldDescription><![CDATA[]]></fieldDescription>
 </field>
 <field name="month" class="java.math.BigDecimal">
  <fieldDescription><![CDATA[]]></fieldDescription>
 </field>
 <field name="item" class="java.lang.String">
  <fieldDescription><![CDATA[]]></fieldDescription>
 </field>
 <field name="num_employee" class="java.lang.Integer">
  <fieldDescription><![CDATA[]]></fieldDescription>
 </field>
 <field name="date" class="java.lang.String">
  <fieldDescription><![CDATA[]]></fieldDescription>
 </field>
 <background>
  <band splitType="Stretch"/>
 </background>
 <title>
  <band height="79" splitType="Stretch">
   <staticText>
    <reportElement x="0" y="21" width="555" height="42" uuid="24c5588c-c842-4b07-826c-5406fabc1dcd"/>
    <textElement textAlignment="Center" verticalAlignment="Middle">
     <font size="14" isBold="true"/>
    </textElement>
    <text><![CDATA[STAFF HEADCOUNT]]></text>
   </staticText>
  </band>
 </title>
 <pageHeader>
  <band splitType="Stretch"/>
 </pageHeader>
 <columnHeader>
  <band splitType="Stretch"/>
 </columnHeader>
 <detail>
  <band splitType="Stretch"/>
 </detail>
 <columnFooter>
  <band splitType="Stretch"/>
 </columnFooter>
 <pageFooter>
  <band splitType="Stretch"/>
 </pageFooter>
 <summary>
  <band height="314" splitType="Stretch">
   <lineChart>
    <chart>
     <reportElement x="0" y="73" width="555" height="241" uuid="38174181-df12-4346-8075-67cb2f8c473c"/>
     <chartTitle/>
     <chartSubtitle/>
     <chartLegend/>
    </chart>
    <categoryDataset>
     <categorySeries>
      <seriesExpression><![CDATA[$F{item}]]></seriesExpression>
      <categoryExpression><![CDATA[$F{date}]]></categoryExpression>
      <valueExpression><![CDATA[$F{num_employee}]]></valueExpression>
     </categorySeries>
    </categoryDataset>
    <linePlot>
     <plot/>
     <categoryAxisFormat>
      <axisFormat/>
     </categoryAxisFormat>
     <valueAxisFormat>
      <axisFormat/>
     </valueAxisFormat>
    </linePlot>
   </lineChart>
  </band>
 </summary>
</jasperReport>
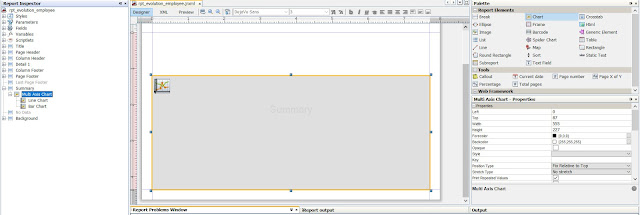
1. Drag Chart from the palette into the Summary band to open the wizard, select the Multi Axits Chart and click Next.
2. In the next step, you choose line chart and click Ok
3. The series expression: $F{item}, the category expression: $F{date} and the value expression: $F{num_employee}
4. In the Report Inspector panel find the Multi Axis chart. Right-click the Multi Axis chart and choose Add Axis chart
5. Choose another bar chart
6. In the Report Inspector panel find the Bar chart and set the Chart Data for the bar Chart
7. Previewing the report
8. In the Bar Chart Properties. Checked the "Show Labels".
9. Uncheck "Show Tick Marks" and "Show Tick Labels".
10. Choose "Value Axis Line Color" to white color.
11. Enter the "Range Axis Min Value Expression" and "Range Axis Max Value Expression" of Bar, Line chart is 0 and 80.
12. In the Bar Chart - Series Colors. Click Add button
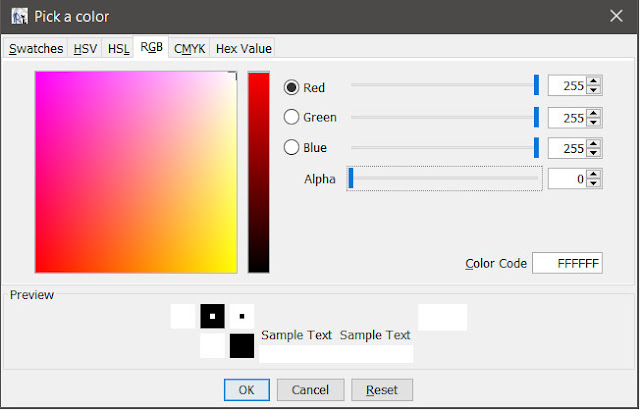
13. In "Pick a color" -> RGB tab -> Alpha set to 0
14. Previewing the report
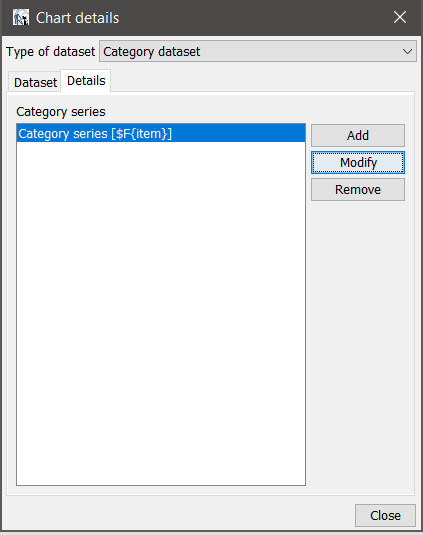
15. In the Report Inspector panel find the Bar chart and choose the Chart Data, modify "Category series[$F{item}]"
16. The series expression update $F{item} to "".
<?xml version="1.0" encoding="UTF-8"?>
<jasperReport xmlns="http://jasperreports.sourceforge.net/jasperreports" xmlns:xsi="http://www.w3.org/2001/XMLSchema-instance" xsi:schemaLocation="http://jasperreports.sourceforge.net/jasperreports http://jasperreports.sourceforge.net/xsd/jasperreport.xsd" name="rpt_evolution_employee" language="groovy" pageWidth="595" pageHeight="842" columnWidth="555" leftMargin="20" rightMargin="20" topMargin="20" bottomMargin="20" uuid="78c6176f-2418-4197-9b59-d543fa10b467">
 <property name="ireport.zoom" value="1.5"/>
 <property name="ireport.x" value="0"/>
 <property name="ireport.y" value="0"/>
 <queryString>
  <![CDATA[SELECT * FROM evolution_employee]]>
 </queryString>
 <field name="year" class="java.math.BigDecimal">
  <fieldDescription><![CDATA[]]></fieldDescription>
 </field>
 <field name="month" class="java.math.BigDecimal">
  <fieldDescription><![CDATA[]]></fieldDescription>
 </field>
 <field name="item" class="java.lang.String">
  <fieldDescription><![CDATA[]]></fieldDescription>
 </field>
 <field name="num_employee" class="java.lang.Integer">
  <fieldDescription><![CDATA[]]></fieldDescription>
 </field>
 <field name="date" class="java.lang.String">
  <fieldDescription><![CDATA[]]></fieldDescription>
 </field>
 <background>
  <band splitType="Stretch"/>
 </background>
 <title>
  <band height="79" splitType="Stretch">
   <staticText>
    <reportElement x="0" y="21" width="555" height="42" uuid="24c5588c-c842-4b07-826c-5406fabc1dcd"/>
    <textElement textAlignment="Center" verticalAlignment="Middle">
     <font size="14" isBold="true"/>
    </textElement>
    <text><![CDATA[STAFF HEADCOUNT]]></text>
   </staticText>
  </band>
 </title>
 <pageHeader>
  <band splitType="Stretch"/>
 </pageHeader>
 <columnHeader>
  <band splitType="Stretch"/>
 </columnHeader>
 <detail>
  <band splitType="Stretch"/>
 </detail>
 <columnFooter>
  <band splitType="Stretch"/>
 </columnFooter>
 <pageFooter>
  <band splitType="Stretch"/>
 </pageFooter>
 <summary>
  <band height="314" splitType="Stretch">
   <multiAxisChart>
    <chart>
     <reportElement x="0" y="87" width="555" height="227" uuid="f5b38f4d-485f-4c3d-b1a0-ec27e1901c98"/>
     <chartTitle/>
     <chartSubtitle/>
     <chartLegend/>
    </chart>
    <multiAxisPlot>
     <plot/>
     <axis>
      <lineChart>
       <chart>
        <reportElement x="0" y="0" width="0" height="0" backcolor="#FFFFFF" uuid="a4f829ca-695d-4cf2-888b-f648de950e6f"/>
        <chartTitle color="#000000"/>
        <chartSubtitle color="#000000"/>
        <chartLegend textColor="#000000" backgroundColor="#FFFFFF"/>
       </chart>
       <categoryDataset>
        <categorySeries>
         <seriesExpression><![CDATA[$F{item}]]></seriesExpression>
         <categoryExpression><![CDATA[$F{date}]]></categoryExpression>
         <valueExpression><![CDATA[$F{num_employee}]]></valueExpression>
        </categorySeries>
       </categoryDataset>
       <linePlot>
        <plot/>
        <categoryAxisFormat>
         <axisFormat/>
        </categoryAxisFormat>
        <valueAxisFormat>
         <axisFormat/>
        </valueAxisFormat>
        <rangeAxisMinValueExpression><![CDATA[0]]></rangeAxisMinValueExpression>
        <rangeAxisMaxValueExpression><![CDATA[80]]></rangeAxisMaxValueExpression>
       </linePlot>
      </lineChart>
     </axis>
     <axis>
      <barChart>
       <chart>
        <reportElement x="0" y="0" width="0" height="0" backcolor="#FFFFFF" uuid="5c22f4cb-752a-475d-8ad0-d4dee1e770d6"/>
        <chartTitle color="#000000"/>
        <chartSubtitle color="#000000"/>
        <chartLegend textColor="#000000" backgroundColor="#FFFFFF"/>
       </chart>
       <categoryDataset>
        <categorySeries>
         <seriesExpression><![CDATA[""]]></seriesExpression>
         <categoryExpression><![CDATA[$F{date}]]></categoryExpression>
         <valueExpression><![CDATA[$F{num_employee}]]></valueExpression>
        </categorySeries>
       </categoryDataset>
       <barPlot isShowLabels="true" isShowTickLabels="false" isShowTickMarks="false">
        <plot>
         <seriesColor seriesOrder="0" color="rgba(255, 255, 255, 0.0)"/>
        </plot>
        <itemLabel/>
        <categoryAxisFormat>
         <axisFormat/>
        </categoryAxisFormat>
        <valueAxisFormat>
         <axisFormat axisLineColor="#FFFFFF"/>
        </valueAxisFormat>
        <rangeAxisMinValueExpression><![CDATA[0]]></rangeAxisMinValueExpression>
        <rangeAxisMaxValueExpression><![CDATA[80]]></rangeAxisMaxValueExpression>
       </barPlot>
      </barChart>
     </axis>
    </multiAxisPlot>
   </multiAxisChart>
  </band>
 </summary>
</jasperReport>
Table structure for evolution_employee
CREATE TABLE `evolution_employee` (
  `year` decimal(10,0) DEFAULT NULL,
  `month` decimal(10,0) DEFAULT NULL,
  `item` varchar(255) DEFAULT NULL,
  `num_employee` int(11) DEFAULT NULL,
  `date` varchar(255) CHARACTER SET utf8 COLLATE utf8_general_ci DEFAULT NULL
) ENGINE=InnoDB DEFAULT CHARSET=utf8;
Records of evolution_employee
INSERT INTO `evolution_employee` VALUES ('2019', '1', 'Total Marketing staff number', '20', '2019 Jan');
INSERT INTO `evolution_employee` VALUES ('2019', '2', 'Total Marketing staff number', '25', '2019 Feb');
INSERT INTO `evolution_employee` VALUES ('2019', '3', 'Total Marketing staff number', '15', '2019 Mar');


